Bar Graph Vs Line Graph: How to Choose the Right Chart
Bar graph vs line graph: which one should you use? Use bars to compare separate groups, like sales by product. Use a line to show how a value changes over time, like monthly rainfall. This guide explains why the rule works, how to handle tricky cases, and which mistakes can mislead a chart.
Bar Graph vs Line Graph at a Glance
|
Feature |
Bar Chart |
Line Chart |
|---|---|---|
|
Best for |
Comparing categories |
Showing trends over time |
|
X-axis |
Distinct groups (products, regions, teams) |
Ordered, continuous values (days, months, years) |
|
Answers the question |
“Which is bigger?” |
“How did it change?” |
|
How it encodes data |
Length of each bar |
Position and slope of a line |
|
Y-axis baseline |
Should start at zero |
Can start above zero |
|
Weak spot |
Gets crowded with many categories |
Misleads if used on unrelated categories |
|
Example |
Sales by product |
Population by year |
What Is a Bar Graph?
A bar graph uses rectangular bars to compare values across separate categories. It is also called a bar chart. The length of each bar shows the value. A longer bar means a bigger number. Each bar stands for one item. That is why bars have gaps between them.
What Is a Line Graph?
A line graph connects data points with a line. It shows how a value changes across an ordered scale. Most often that scale is time. The line tells viewers that one point leads into the next. That makes direction, speed, and turning points easy to see.
Types of Bar Charts
- Vertical Bars (Column Chart): The most common type. Best for short category names.
- Horizontal Bars: Best for long labels like survey answers or country names.
- Grouped Bars: Show several series side by side inside each category. Example: sales for two years in every region.
- Stacked Bars: Split each bar into parts to show a total. Example: revenue by product line.
Types of Line Charts
- Simple Line: One line for one series. Example: daily temperature.
- Multiple Lines: Several lines on one chart. Use them to compare trends. Example: traffic from three channels.
- Lines with Markers: A dot sits on each data point. This helps when dates are not evenly spaced.
The Core Difference: Comparison vs Change
Think about the question your viewer needs to answer:
“Which one is bigger?” → Use bars.
“How is it changing?” → Use a line.
Bars make it easy to compare the size of separate categories. A line connects data points so viewers can quickly see direction, patterns, rises, and falls. In simple terms, bars emphasize the values, while lines emphasize the trend.
When to Use a Bar Chart
- Comparing Categories: Sales by product, revenue by region, budget by department
- Ranking: Top 10 websites, best-performing campaigns, highest-scoring students
- Survey Results: How many people picked each answer
- Showing Parts of a Total: Stacked bars for revenue split by product line
- Showing a Handful of Time Periods: Four quarters, or three years, where each period is a distinct result
Quick tip: Sort bars from largest to smallest unless the categories have a natural order (like age groups). Sorted bars are far easier to read.
When to Use a Line Chart
- Trends Over Time: Website visits per month, stock prices, temperature through the year
- Many Data Points: 12 months, 52 weeks, or daily data, where bars would look like a wall
- Spotting Patterns: Seasonality, spikes, dips, or plateaus
- Comparing Trends: Several lines on the same timeline (for example, traffic from three channels)
- Before-and-after Analysis: Performance before and after a campaign launch
Same Data, Two Charts
Here’s one small dataset: monthly sales in thousands of dollars.
|
Month |
Jan |
Feb |
Mar |
Apr |
May |
Jun |
|---|---|---|---|---|---|---|
|
Sales ($K) |
12 |
15 |
14 |
19 |
23 |
21 |
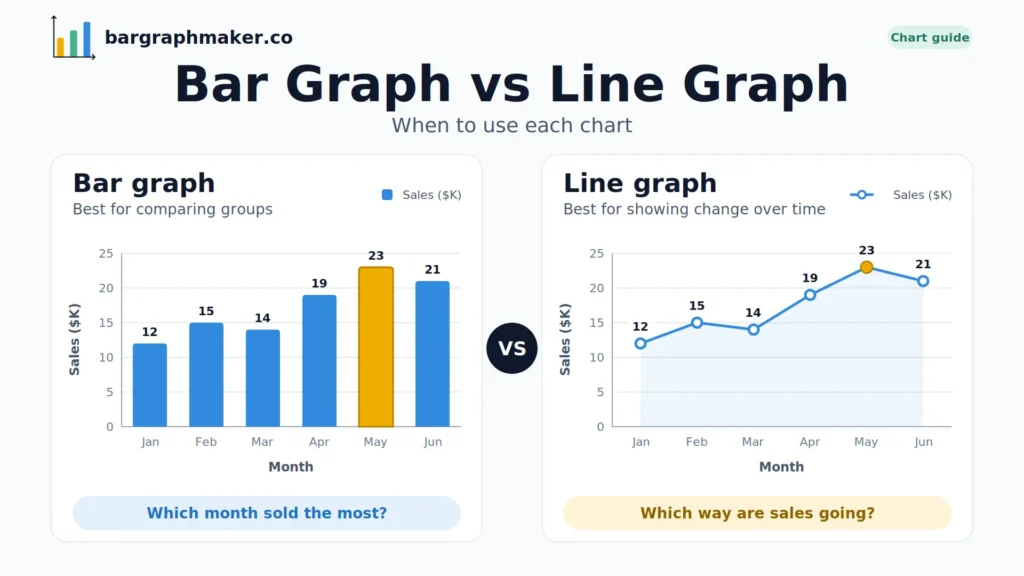
As bars, you immediately see that May was the best month and January was the weakest. Each month stands alone as a result.
As a line, you see sales climbing steadily with a small dip in March and a pullback in June. The story is momentum.
With only six points, either chart can work, so let your message decide.
A 10-Second Test to Pick the Right Chart
Ask yourself these three questions:
- Is my x-axis made of ordered, continuous values like time? If yes, lean toward a line.
- Is my x-axis made of separate names, like products or countries? If yes, use bars.
- Would it make sense to draw a line between two of my points? If a point halfway between “Chicago” and “Denver” means nothing, don’t use a line.
Can You Combine Bars and Lines in One Chart?
Yes. This is called a combo chart. It works well when you want to show two related things at once, such as:
- Monthly revenue as bars with profit margin as a line
- Actual sales as bars with a target as a line
- Monthly orders as bars with conversion rate as a line
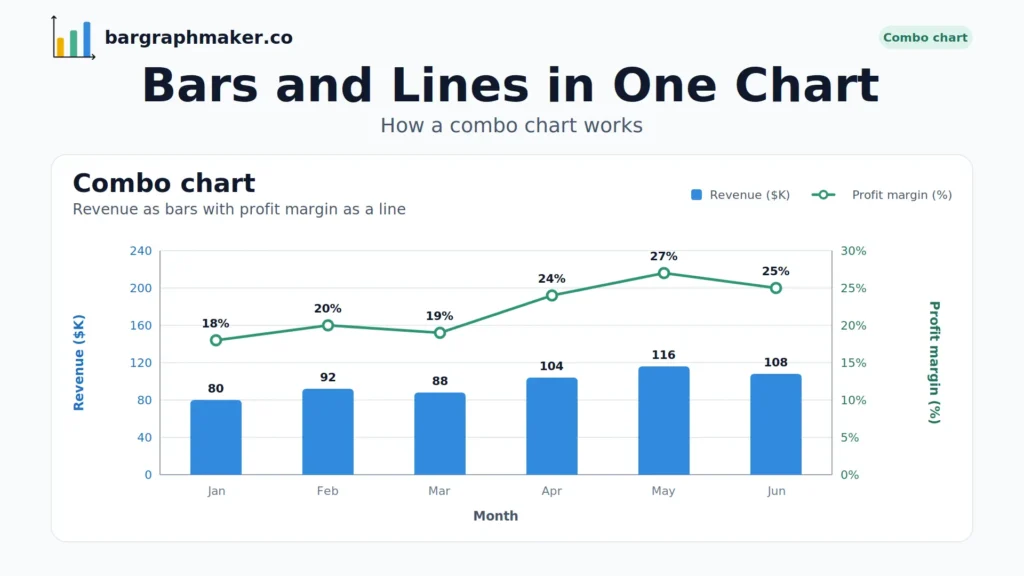
Combo charts often use two y-axes because the two measures have different units. Label both axes clearly and use different colors. Otherwise, viewers can easily read a relationship into the chart that isn’t in the data.
Common Mistakes When Choosing Between Bars and Lines
1. Using a line for unrelated categories.
A line suggests a meaningful progression between points. For unrelated categories such as Marketing, Sales, and Support, use bars instead.
2. Starting the y-axis of a bar chart above zero.
Bars communicate value through length. Cut off the bottom and a small difference looks enormous. Always start bars at zero. Lines can use a zoomed-in range because they show position and movement, not length, but label the axis clearly.
3. Cramming in too many categories.
Past roughly 10 to 12 bars, charts get hard to read. Switch to horizontal bars, group smaller items into “Other,” or filter to the top results.
4. Using too many lines.
More than four or five lines turn into “spaghetti.” Highlight the line that matters and mute the rest, or split the data into separate charts.
5. Ignoring uneven time gaps.
If your dates aren’t evenly spaced (say, data for 2018, 2019, and 2024), a line that spaces them equally will distort the trend. Use a proper time scale.
6. Relying on color alone.
Some viewers can’t tell certain colors apart. Add direct labels, patterns, or different line styles so the chart works for everyone.
How to Make a Bar or Line Chart Online
You don’t need Excel skills or design experience. With a free online tool like Bar Graph Maker, you can:
- Enter or paste your data.
- Add a clear title and axis labels with units.
- Adjust colors and bar widths.
- Download your chart as an image for reports, slides, or blog posts.
FAQs
Final Thoughts
The bar graph vs line graph choice comes down to one question. Do you want people to compare or to see change? Pick bars to compare. Pick a line to show change. When in doubt, ask whether a point between two of your data points would mean anything. If it wouldn’t, use bars.
About This Guide
This guide was written and reviewed by Muhammad Umer Shuaib, who builds and maintains bargraphmaker.co, along with other educational web tools like a grade calculator. The examples and explanations on this page are created specifically for this guide.